 BPI NEWSLETTER
Dedicated to the art and
engineering of pore pressure prediction and potential drilling hazards.
 Issue Number 1
WELCOME to the premier
issue of the Baird Petrophysical International, Inc. NewsLetter. This issue is dedicated to following
individuals who are pioneers in the pore pressure prediction field:
Eugene
S. Pennebaker Paul E.
Pilkington Leo J.
McClure
We hope you will join us in recognizing these individuals
and the significant contribution they made to our industry. This newsletter will routinely contain
articles written by several of these individuals especially for inclusion in
this newsletter. Some will be regular contributors
and some will be honored as guest writers.
We think you will agree that they offer some valuable viewpoints and
perspectives on the work that we are doing today.
This newsletter is designed for distribution by email and
snail mail. This keeps our costs
reasonable and insures timely delivery to you, while allowing you to easily
enroll (and remove) your name from our distribution via our Internet Home
Page. It further allows the recipients
to easily comment on the contents of this publication. If you do not find this newsletter valuable
and useful, interesting or anything else that would encourage your continued
enrollment, please send us you comments as this is a work in progress and will
improve and expand with time.

Figure 1. Eugene S. Pennebaker, Jr., Exxon Retiree, currently living in Corpus Christi,
Texas. Visited by BPI staff, April 28, 2000.
E. S. “Gene” PENNEBAKER, Jr.
Mr. Pennebaker contributed greatly as a pioneer to pore
pressure prediction. While employed at Humble Oil (now Exxon Mobil) Pennebaker
wrote the book on the utilization of seismic reflection data to identify and
quantify abnormal pressure, drilling rate of penetration and especially the
drilling parameters’ relationships to geologic age and seismic interval
velocity. BPI and McClure and Associates jointly refined, re-defined and
improved on the methods laid out by Pennebaker in 1965. Today with this first
issue of The BPI Newsletter, we salute Eugene S. Pennebaker, Jr. for his
contributions to drilling safety by use of pore pressure prediction. Please see
article below by Leo J. McClure, History and Pioneers of Pore Pressure
Prediction.
PRESSURE AND LOG PLOTTING AND REPORT STANDARDS
BPI NEWSLETTER will attempt to do some missionary work in
the area of standards --- standards for terminology, standards of plotting,
standards for interpretation processes, and standards in other areas that are
common to pore pressure understanding. Presently there exist no standards and
thus there is a lack of communication even within the pore pressure profession.
This has specifically caused misunderstanding and results that have been
subject to numerous misunderstood reports. We intend to propose BPI’s standards
to the industry because we believe that these standards are both useful and
necessary for the safety and efficiency of drilling of oil and gas wells. We
will show how the more common tools, such as overlays and well-to-well
comparisons, will be more universally applicable. This will lead to industry standards for this important wok, led
by BPI’s leadership in this area. Due to the obvious lack of standards, we
hereby solicit your candid comments and promise to address them in subsequent
issues. The result of this effort shall be a recommended set of standard
plotting scales and presentation formats. BPI will not let this issue rest
without a recommended solution.
PRACTICAL WELL PLANNING SOFTWARE
“Software is a tool and not a solution,” Jack D. Hall
“Computers, God’s gift to mankind?” Paul E. Pilkington
HISTORY AND PIONEERS OF PORE PRESSURE PREDICTION
by Leo J. McClure, Guest Columnist
Electrical log pore pressure plotting started in the early
1960’s by using the old “Electric Logs” of that era. The resistivity curve value was plotted on single cycle semi-log
paper with a depth scale of one inch equals 1,000 feet for depth and the
resistivities plotted by ohms or tenths of an ohm across the top of the
paper. This system worked fairly well
until industry started drilling deeper wells such as 15,000 to 16,000 feet then
the paper became ungainly long. Also
the early clear plastic readers were very large and anything but easy to use to
quantify the log resistivity readings.
Some of the early men to experiment with this type of log plotting were
Dr. C. E. Hottman and R. K. Johnson, Shell research and drilling personnel, and
a few geologists in the New Orleans office of the old Humble Oil and Refining
Co. which is today Exxon Company. Dr.
W. E. Wallace, Forest Oil Company, published his ideas in 1964 and 1965 in the
Oil & Gas Journal. W. R. Matthews
and John Kelly, Mobil Oil Company, also were in the early pioneer group working
on pore pressures from electric logs.
One of the pioneers on drilling problems in general and on
pore pressure evaluation in particular was Eugene S. Pennebaker, Jr. He was employed by Humble in the south Texas
Division in Corpus Christi. He did
considerable work and research on seismic data to determine formation pressures
before the well was drilled. This work
was published in the SPE landmark paper #2165 entitled “An Engineering
Interpretation of Seismic Data”. From
his original study of 350 well velocity surveys or check shots, he developed
several pressure readers. The first and
one used in his paper was for use with seismic interval velocities; the second
one was for use with the sonic log called an acoustic reader (or overlay). The one most used in South Texas was his
conductivity reader developed for the Miocene Frio formation wells that Humble
Oil was drilling on the King Ranch and adjoining leases at that time. In our practice we will use modifications of
his acoustic and conductivity readers as well as other proven methodology.
Some Industry News
Drill Abnormal Pressure Safely
By Leo J. McClure, Guest Columnist, Baird Petrophysical Newsletter
Practical field interpretation of data is the main thrust of
this newsletter and this column. Knowledge of certain geological principles and
physical laws are helpful in the understanding of the science of abnormal
pressure, but the actual interpretation of the drilling data generated at the
wellsite is an acquired art based mainly upon experience. Therefore, this
column is written expressly for drilling personnel --- roughnecks, drillers,
toolpushers, drilling superintendents, engineers, geologists, service company
personnel --- or any other person associated with boring a hole into the earth
to find hydrocarbons.
Hopefully, this newsletter will give you the knowledge to
recognize overpressured formations while you are drilling. And you can avoid
fire, killed or injured persons, junked holes, severely damaged oil and gas
reservoirs, and loss of time, equipment and money. Literally, you can Drill Abnormal Pressure Safely.
This newsletter is not a cook book for drilling a
difficult, overpressured well. It does not replace common sense, sound
reasoning, or proven detailed procedures for a specific job. Above all, the
manual will not make you an instant expert on abnormal-pressure drilling;
expert status is achieved only through extensive study and on-the-job
experience.
You will learn some basics of how to predict, detect, and
evaluate abnormally pressured formations, and how to solve the resultant
drilling and casing problems.
Recommendations for Improving Exploration in Overpressured Areas, Part I:
Overpressures – Pressure and Temperatures
by Paul E. Pilkington, Guest Columnist, Baird Petrophysical Newsletter
Engineers and explorers working together can supplement
conventional structural data with additional information derived from seismic
structure maps, seismic velocity analysis, offset drilling data and wireline
logs. These methods have been presented at various seminars for the past
several years.
These methods involve using pressure, temperature, and
wireline log data in addition to seismic mapping and velocity analysis. These
methods can determine depth cut-offs, areas where modified seismic techniques
may be required for seismic stratigraphy studies, and areas of poor source
potential in overpressures. In addition, statistical analysis of probabilities of
encountering sands with sufficient thickness and permeability for economic
rates appear feasible.
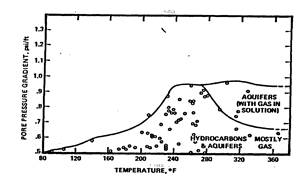
Figure 2. Deep
overpressured reservoirs fall into a temperature-pressure envelope.
Deep overpressured prospects have been evaluated for the
past several years using the Timko-Fertl pressure-temperature chart shown in
Figure 2. In all of the deep wells drilled into the temperature-pressure
envelope area noted as aquifers, no commercial hydrocarbons have been
encountered.
The chart shown in Figure 2 applies solely to clean Tertiary
clastic sediments offshore Louisiana and Texas. It does not apply to
areas offshore Texas where calcareous sands are found, because the consolidated
sands can fracture and create additional storage volume. It does not apply to the
deep Smackover and Norphlet areas, because generation and trapping mechanisms
are different.
Pressures and temperatures can be estimated from seismic,
drilling and wireline data. Seismic mapping and velocity analysis can be used
to help extrapolate offset data into the proposed location.
This chart can be used within
an area to determine the maximum depth cut-off’s for exploratory drilling and
enable more effective use of the exploratory dollar. One major oil company
completed a study about two years ago, which indicated one exception to
the envelope from all deep Louisiana wells drilled to that date. It is reported
to be slightly outside the line. However, my personal experience of monitoring
drilling for 27 years offshore and making pore pressure plots for 35 years has
failed to find the one well, which is reported to be the only exception.
Effect of Dip on Abnormal Pressure
By Ralph W. Baird, President, Baird Petrophysical International. Inc.
Figure 3 illustrates the effect dipping beds have on pore
pressure in abnormally pressured formations. Moving up-dip results in higher
pore pressure gradient in mud weight equivalents (equivalent mud weight, or,
EMW). This fundamental, simple relationship when used with seismic structural
mapping, offset wells and seismic velocity analysis can help remarkably to
estimate the expected pore pressure at the proposed well location. The same
process works in reverse when you move down-dip.
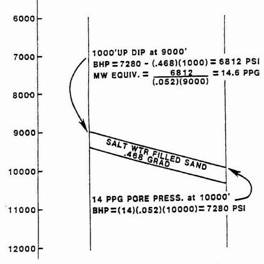
Figure 3. Effect of
dip on formation pore pressure.
STANDARDS or
the lack thereof: A continuing column
by Ralph W. Baird, President, BPI
Most of us have probably experienced the frustration and
potential errors faced when trying to compare data from separate wells where
the plots, data, scales and presentations all seem to collaborate to make the
comparison either impossible or dangerously misleading. You may even have a desk drawer full of
overlays, none of which seem to be on the scale and units of the data you are
attempting to interpret. This column
will discuss how some of these tools came to exist, why it is of extreme
importance to have a semblance of standards, and how we are going to accept
these standards.
The most basic area of standards is also the oldest—metric
or Imperial (English) units?? Our
industry has made a concerted and effective effort to move to the metric system
used by most of the scientific and governmental world. But we have to realize we have left
behind some important people who have either chosen not to commit to metric, or
who may not have been provided the tools necessary to make this transition.
An ever present and important part of our work is our
communications with the rig crew who are actually operating the rig and whose
cooperation and input we desperately need to drill any well safely and
efficiently. Many if not most of these
personnel are not well versed in the metric system. If we are to communicate information to these critical personnel,
we must do so in the terms they are most comfortable using. In most cases these are Imperial (English)
units — i.e., lbs/gal, ft/hr, psi, pounds, or Tons. If any of these personnel happen to be uncomfortable with
conversions, which BPI has actually witnessed, they may make a wrong guess, or
translation, which could lead to serious, well control problems
BPI Newsletter is
published monthly and freely distributed and copied by Baird Petrophysical
Group, Inc., 1784 W. Sam Houston Pkwy N., Houston, Texas 77043-2723.
Disclaimer:
The results discussed herein
are based on interpretation of drilling engineering, geological, geophysical
and other scientific data supplied to Baird Petrophysical by its various
customers on a private basis. It is the
Reader’s responsibility to value its use.
Baird Petrophysical specifically disclaims and does not warrant any of
its news, comments, interpretations or opinions about the information presented
here.
Mailing Address for BPI:
BPI Baird Petrophysical
1784 W. Sam Houston Pkwy N.
Houston, TX 77043-2723
Communication with BPI:
Tel: (713) 461-1784
Fax: CALL
Email: 
Web: www.bairdpetro.com
Publications of BPI:
BPI Newsletter, by BPI Staff.
Simple Seismics, by Nigel Anstey.
Drill
Abnormal Pressure Safely, by Leo J. McClure.
Shallow Seismic Safety Study, by Ralph W. Baird, et al.
Seismic Interval Velocity Analysis, by Leo J. McClure.
CopyrightÓ2000-2008
Baird Petrophysical Group, Inc.